Astronomy — Ephemeris Data and Orbital Calculations
Several packages exist that help us work out where things are in the sky, or how to calculate their orbits, or plot trajectories between them.
We can also generate interactive 3D plots showing how different orbital planes relate to each other.
For creating educational resources, the ability to look-up reference data for planetary bodies and include it materials, as well as generating image assets associated the motion of those bodies, reduces the potential for errors.
For learners working in an interactive notebook, having access to the tools of production allows learners to create and explore their own visual assets and check their understanding or many physical problems in a visual way.
poliastro
The poliastro package provides a range of tools to support interactive Astrodynamics and Orbital Mechanics activities.
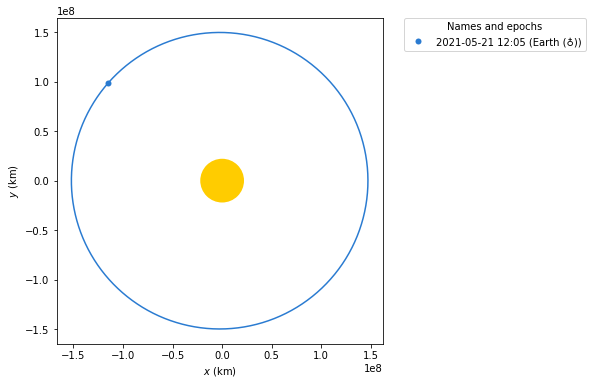
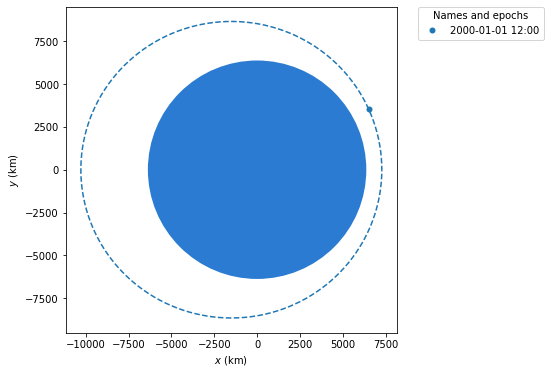
For example, we can plot an orbit on a particular date:
from poliastro.bodies import Earth, Sun

from astropy.time import Time
from astropy.coordinates import solar_system_ephemeris
solar_system_ephemeris.set("jpl")

EPOCH = Time("2021-05-21 12:05:50", scale="tdb")

Earth.plot(EPOCH);
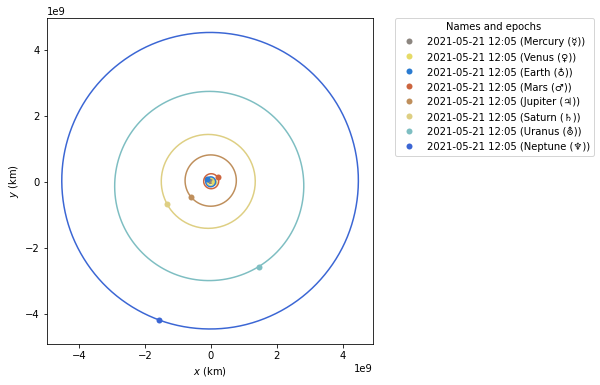
Or the orbits and locations of planets in the solar system on a particular date:
from poliastro.plotting.misc import plot_solar_system

plot_solar_system(epoch=EPOCH);
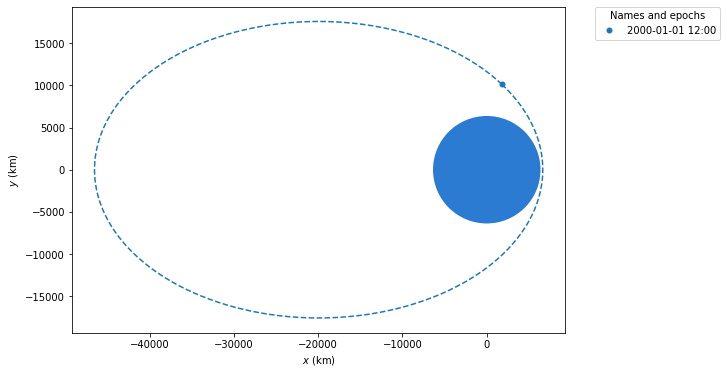
We can plot the orbits of various named objects:
from poliastro.examples import molniya

molniya.plot();
We can also define our own orbits:
from astropy import units as u

from poliastro.twobody import Orbit

# Data from Curtis, example 4.3
r = [-6045, -3490, 2500] * u.km
v = [-3.457, 6.618, 2.533] * u.km / u.s

orb = Orbit.from_vectors(Earth, r, v)

orb
7283 x 10293 km x 153.2 deg (GCRS) orbit around Earth (♁) at epoch J2000.000 (TT)
We can then plot a 2D representation of the orbit:
orb.plot();
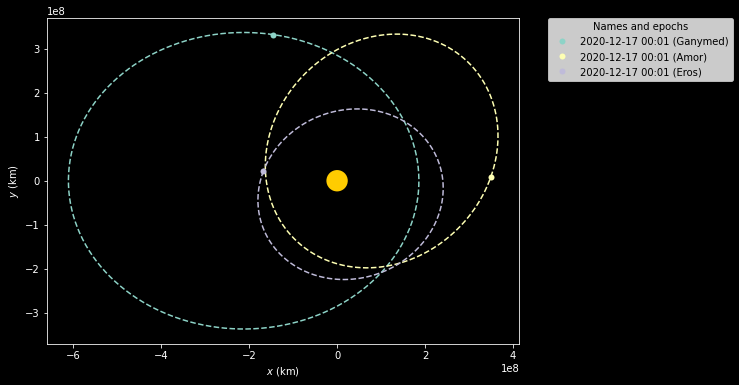
from poliastro.plotting import StaticOrbitPlotter
from poliastro.frames import Planes

ganymed = Orbit.from_sbdb('1036') # Ganymed IAU number
amor = Orbit.from_sbdb('2001221') # Amor SPK-ID
eros = Orbit.from_sbdb('2000433') # Eros SPK-ID

#Play with the style and use a dark background
frame = StaticOrbitPlotter(plane=Planes.EARTH_ECLIPTIC, dark=True)

frame.plot(ganymed, label="Ganymed")
frame.plot(amor, label="Amor")
frame.plot(eros, label="Eros");
We can also render 3D interactive orbits from a demo model:
from poliastro.examples import churi, iss

churi.plot(interactive=True, use_3d=True)
Construct a view from two objects:
from poliastro.plotting import OrbitPlotter3D

frame = OrbitPlotter3D()

frame.plot(molniya)
frame.plot(iss)
pyephem
pyephem is a package that supports basic astronomical computations.
Given a date and location on the Earth’s surface, it can compute the positions of the Sun and Moon, of the planets and their moons, and of any asteroids, comets, or earth satellites whose orbital elements the user can provide. Additional functions are provided to compute the angular separation between two objects in the sky, to determine the constellation in which an object lies, and to find the times at which an object rises, transits, and sets on a particular day.
Original examples based on: http://nbviewer.jupyter.org/url/www.sc.eso.org/~bdias/pycoffee/codes/20160908/pyephemexamples.ipynb
See also pysolar for calculating the intensity of solar radiation at different points of the Earth for particular datetimes.
What time is it in London?
import ephem
import numpy as np

#Define an observer
obs = ephem.city('London')

#Get current time
ephem.localtime(obs.date).strftime("%Y-%m-%d %H:%M")
'2021-05-26 00:51'
When’s the next sunset and sunrise?
sol = ephem.Sun()

sol.compute(obs)

print(obs.next_setting(sol, use_center=True))
print(obs.next_rising(sol, use_center=True))
2021/5/26 19:59:14
2021/5/26 03:56:41
As with many packages, if the function we want is not evailable, we can create it once and start using it immediately, potentially iterating it and packaging it ourselves, or even contribyting it back to the original package if appropriate.
Note
As well as creating code for use in supporting the creation of media assets or to support custom calculations, many useful functions may also be developed a line of a code at a time to show the development of a “functional argument” that goes from raw data to a perhaps more meaningful re-presentation of it.
In many cases, it may also be possible to demonstrate the steps involved in a particular function created to support asset production as part of a worked exercise.
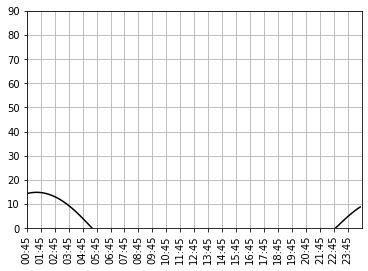
For example, how might we plot the altitude of a body above the horizon over a 24 hour period from a set of ephemeris data?
#Plotting the altitude

# For example, this could perhaps be used as a the basis for a student exercise
# in which students learn how to plot the altitude of various bodies relative to various
# locations on various dates
# Other flavours of exercise are also possible.
# For example, a parameter sweep where you try to optimise or learn something about
# the altitude of a body from a particular location over a range of dates?
import matplotlib.pyplot as plt

def plotAltitude(obs, obj):
    resolution = 0.1
    datelist = [ephem.date(obs.date + x*ephem.hour) for x in np.arange(0,24,resolution)]
    positions = [0]*len(datelist)

    for i in range(len(datelist)):
        obs.date = datelist[i]
        obj.compute(obs)
        positions[i] = obj.alt*(180./3.1415)

    plt.plot(np.arange(0,24,resolution),positions,'-k')
    plt.gca().set_ylim(0,90)
    plt.gca().set_xlim(0,24)
    plt.xticks(np.arange(0,24),rotation='vertical')
    plt.gca().set_xticklabels([ephem.localtime(d).strftime("%H:%M") for d in datelist][::int(1/resolution)])
    plt.grid()
    plt.show()
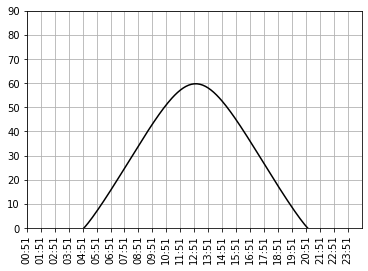
Let’s use the above function to plot the motion of the sun:
plotAltitude(obs, sol)
Or how about the motion of the moon?
moon = ephem.Moon()
plotAltitude(obs, moon)